Stock Market Top Indicator

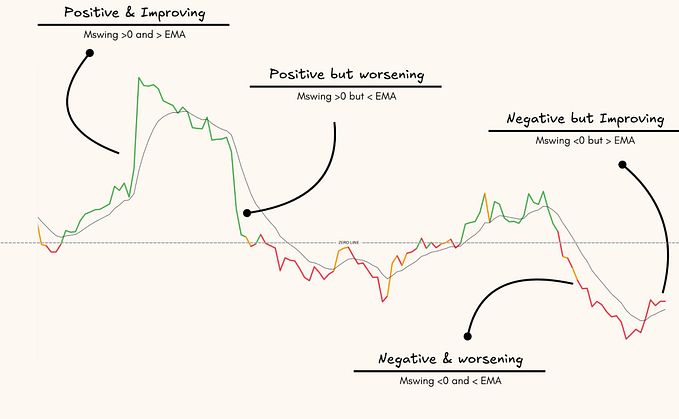
How to Use: The higher up the indicator is, the higher the chance that the stock market is near a market top, and the greater the chance of a market correction. The red line is the mean. The indicator will be above this level approximately 50% of the time.
The yellow zone indicates that the chance of a market correction is moderately elevated.
The orange zone indicates that the chance of a market correction is very high.
The red zone indicates that the chance of a market correction is extremely high. The stock market rarely reaches this level.
Strategy: Since the stock market rarely reaches the red level, and when it does so a correction is often imminent, one strategy that I would use this indicator for would be to sell SPY credit call spreads using liquid options that are about 1-year out from expiration (must have sufficient open interest to easily exit position) whenever this indicator reaches the red level. I would then close the position whenever the market corrects. Using a credit call spread helps manage risk. One disadvantage of this trade is the need to post options collateral for the duration of the time it takes the market to correct. Remember to never short the market by selling naked call options.
Methodology: This indicator applies log-linear regression to an equal weighting of three broad stock market indices and adjusts that weighting by the volatility of the S&P 500.
Updates: The indicator will be updated at the start of every month, but I am happy to update it any time upon request (just message me here for an updated version).
Disclaimer: While I am hopeful that this probabilities-based indicator is helpful in ascertaining the chance of an S&P 500 correction, there are never guarantees in the stock market. Please do not rely solely on this indicator in making a trade.


